on
Verdure
- Get link
- X
- Other Apps
It stands to reason that policies that aim to reduce drug prices or squeeze life science companies profits are likely to decrease incentives to finance the research and development needed to bring a drug to market. Previous estimates claim that bringing a new drug to market may cost over $2 billion, and life science companies will need to cover these cost. A key question then, is how much would potential US policies that reduce life science company returns affect new innovation. A Congressional Budget Office report aims to answer this question and finds that:
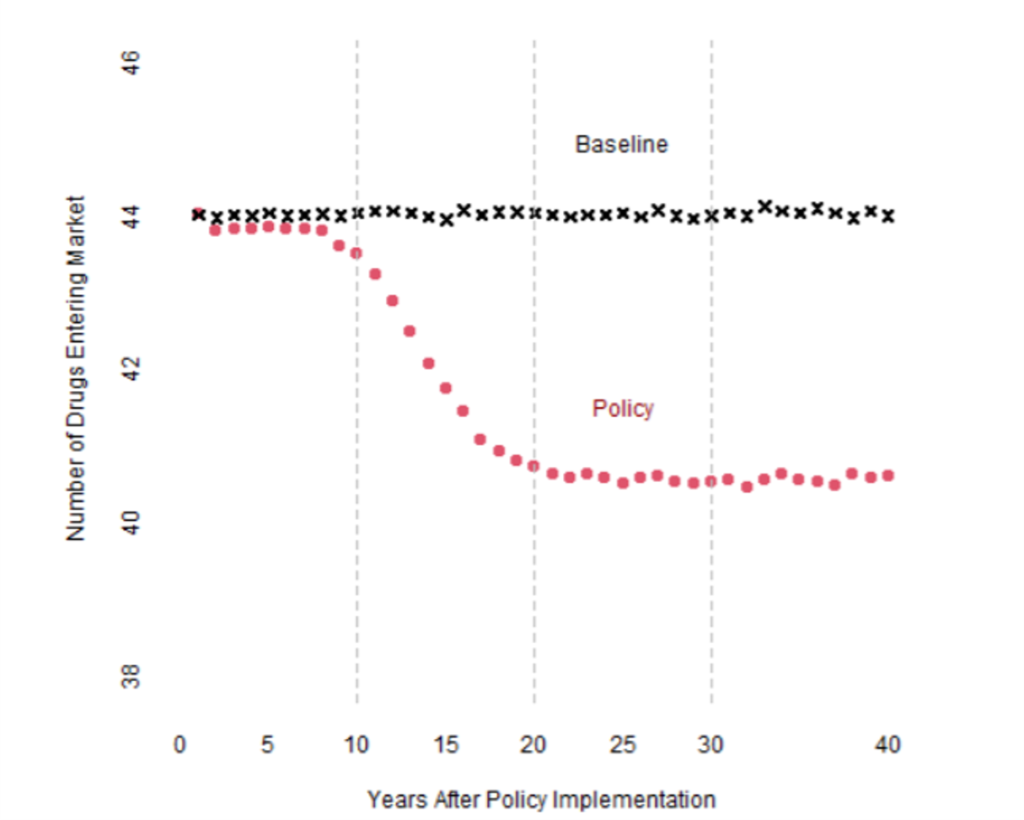
A 15 percent to 25 percent reduction in expected returns for drugs in the top quintile of expected returns is associated with a 0.5 percent average annual reduction in the number of new drugs entering the market in the first decade under the policy, increasing to an 8 percent annual average reduction in the third decade.
The timing of the impact of such a policy on drug development is shown graphically below.

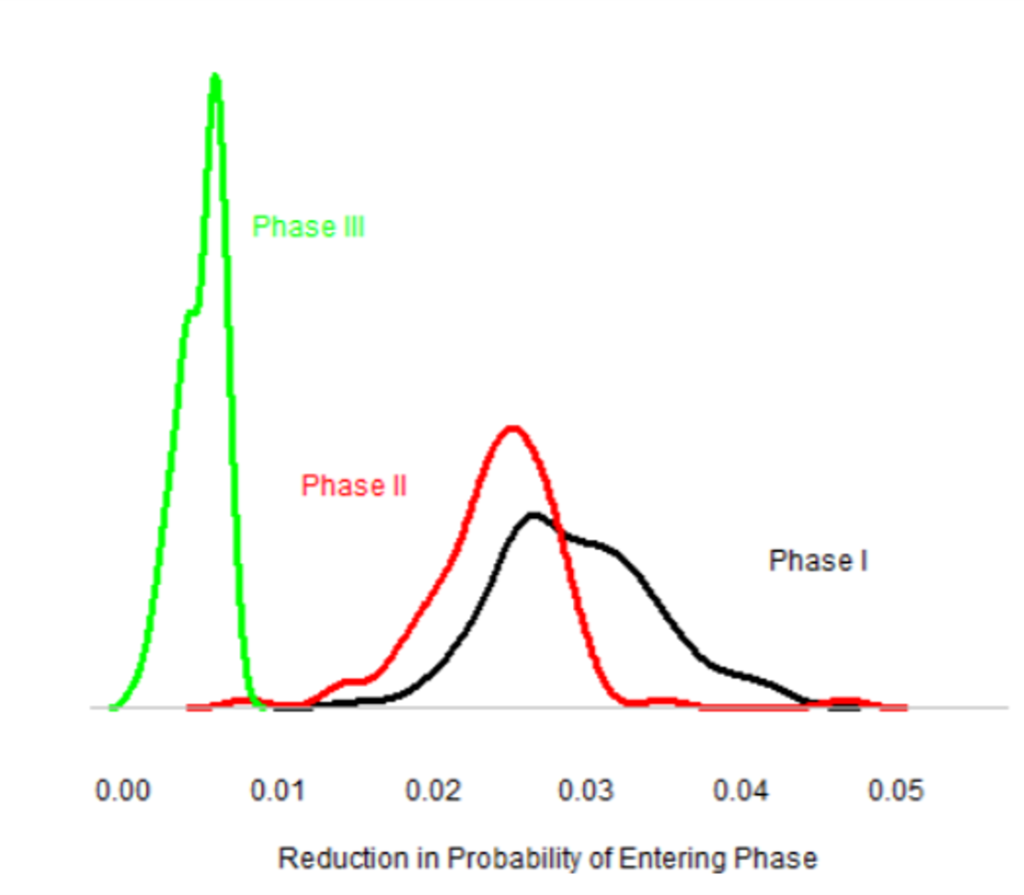
The reason for the slow impact is that it takes many years for a drug to come to market. Thus, drug price reductions in have a modest impact on short-run innovation, but a major impact on long-run innovation. In part, CBO believes that the policies will have the largest impact on Phase 1 and Phase 2 investments, but less so on Phase 3. The figure below show this impact graphically, accounting for uncertainty in some of the underlying parameters. One can see that CBO believes that price controls are likely to affect investment decisions at the Phase 1 and 2 stage, but once a drug has positive results after Phase II, CBO believes drug companies are likely to push ahead with phase 3.

What evidence does CBO cite? Some of the key articles cited include the following:
The new CBO model is an update of the 2019 version. Their model uses an elasticity of new drug introductions with respect to life science returns of 0.45. The model uses drug cost estimates from DiMasi, Grabowski, and Hansen (2016) and a Roy model to combine information on revenue and cost. They find that:
The policy example analyzed here is estimated to reduce expected returns by an average of 18 percent, and the model results indicate that it leads to 8 percent fewer new drugs after 25 years
The modelling approach basically uses a hurdle model where pharmaceutical firms only enter the next phase of development (i.e., Phase 1, 2 or 3) if the expected benefits exceed the cost. The key probabilities that inform the model are: (i) the probability a drug is successful conditional on observed results in the current phase, (ii) potential financial benefits of moving to the next phase, (iii) costs of the next phase of drug development, and (iv) financing cost (i.e., the cost of capital). Probability of success and the cost by drug phase comes from DiMasi et al. 2016. Returns are estimated based on Medicare Part D to manufacturers, including confidential data on rebates paid by manufacturers. CBO solves their simulation model using a generalized method of moments (GMM) approach. Standard deviations are estimated using a bootstrap procedure.
CBO does note that the probability of entering each next phase is 10%, 20% and 90% for phases I, II, and III, respectively, but also not that these figures are chosen as they seem to feasibly match the data. Additionally, CBO notes that price negotiations my increase the cost of capital for pharmaceutical firms which would further decrease future innovation due to increased life science company costs.
While popular media often believe that drug price controls will not effect future innovation, CBO clearly believes that there are long-run consequences on innovation to top-down price control policies.
Comments
Post a Comment